The winner takes it all
What does books, songs, movies, photography and websites have in common?
Three things: high upfront costs, low marginal costs (the cost to let one more person see, hear or use the product) and the price is the same (on the internet: free with ads).
Normally when you buy something it is a trade-of between price and quality, but when the price is the same (or roughly the same), what do you do?
You buy the best. Hence most musicians don’t make money, most authors need a “real” job, most websites get no traffic and flickr has tons of pictures because it isn’t worth it to set the system up so that you can buy them.

Picture such as this sunset photo (by: Rachel Kramer) which has cost a lot of time and effort plus gear to make.
We have previously looked at power laws for words (in which I utterly failed to show the expected Zipfs distribution), but it is one thing for words, nobody really cares that “it” is only used 1% as often as “the”; it is an entirely different thing when we talk about people and their income.
Whenever newspapers or anybody else needs cheap outrage they always ends up taking about how the richest 1% owns x% of all the wealth which is exactly what you would expect in a world where there is no reason to not choose the best product. If anything it would surprise you that the split isn’t deeper (and if you dug into the numbers you would find that it was the richest 0.1% owns most of that: A household of two married surgeons are in the top 1% of income and while they live a good life their lifestyle is a lot closer to yours and mine than to that of Elon Musk).
The only reason we have more than one super-mega-hit band in the world is that different people like different music and that most people get tired of hearing the same couple of songs over and over again. The same is is the case for books and movies.
Humans aren’t very good at understanding exponential growth, but we are pretty awesome at pictures, so lets try to look at some graphs to better visualise this.
If we assume the Zipf distribution (that is that item in position x gets 
Only one problem: the article I linked to earlier suggest that the to 1% would own half of the worlds wealth (how accurate that is is another matter). So rather than the Zipf distribution, lets assume that the ith item gets 

So lets see it:
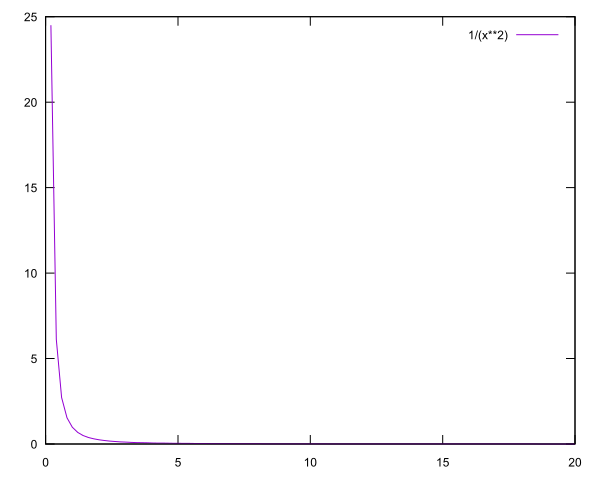 Yep, as shown this is pretty clearly screwed towards the top 1 item.
Now I am not saying that is any way a bad thing, just that it is and it is something we need to take into account when we try to model the world.
As you noticed I mixed discrete and continuous numbers here which you strictly can’t do. So lets fix that by modelling of the most famous power law:
20% of the work will get you 80% of the results.
True? Probably not, but hey everybody else is jumping of this cliff so why shouldn’t we do that too?
So first things first: if the rule is true then it stands to reason that you can apply it recursively on itself, that is you can also do 4% of the work and get 64% of the work, or do 0.8% of the work to get 51.2% of the result.
So lets look at the corresponding graph: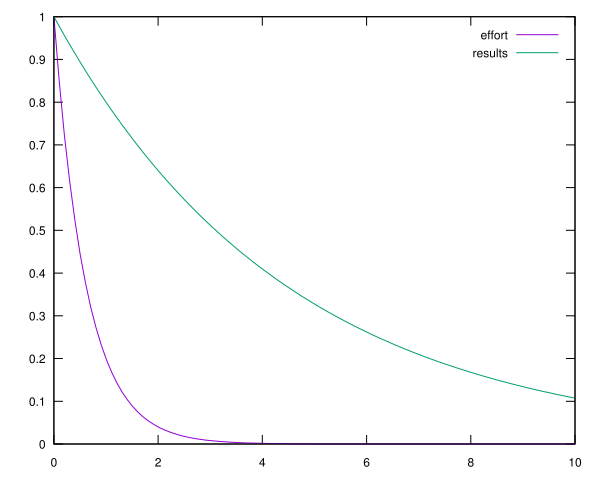
Looking just at the effort curve we can see that almost everything after the second iteration doesn’t matter: indeed the area under the effort curve from 0 to 10 is 0.621335 whereas the area from 0 to 1 is 0.497068 – exactly 80% (as we should expect).
Thus this is a much more extreme curve than the one the author suggested, but not as extreme as other common power phenomenons: the best programmers are supposed to be 10 times as great as the average programmer (that would suggest 

In these kinds of scenarios the winner really do take everything.